1 RUSLE model protocol
1.1 Introduction
1.1.1 Purpose
This RUSLE model is generated to produce a soil erosion map for our study area of the B07 project (based on the EHAS survey). This soil erosion map will later be used for a conditioned Latin hypercube sampling (cLHS) to choose sample locations. It was based on the originals equations from Renard et al. (1991).
1.1.2 Procedure
We follow Thapa (2020) procedure for the RUSLE model based on 5 factors: rainfall, soil strength, slope, land use and conservation. We also used Cossart, Fressard, and Chaize (2020); Almagro et al. (2019) and Mehri et al. (2024) as reference work. The DEM has been filled with the SAGA GIS function Fill Sinks (Wank & Liu); SAGA GIS 7.8.2 version.

Figure 1.1: Methodological framework for potential erosion using RUSLE model (from Thapa, 2020).
1.1.3 Input data
All the data listed below are available freely online.
| Name/ID | Original resolution (m) | Type/Unit | Source |
|---|---|---|---|
| DEM/TE.5 | 25 | Meters | ESA and Airbus (2022) |
| Prec. sum/OT.6 | 1000 | mm | WorldClim2 Fick and Hijmans (2017) |
| Landuse/OT.4 | 10 | - | Zanaga et al. (2021) |
| WRB Soils/OT.11 | 1000 | - | HWSD v2.0 FAO and IIASA (2023) |
1.2 Equations
1.2.1 R Factor
It is the precipitation factor computed from the precipitation raster based on Morgan et al. Morgan, Morgan, and Finney (1984):
\[ R = 38.5 + 0.35P \] For P = precipitation per year in mm.
1.2.2 K Factor
Is the soil strength factor computed from different parameters from soil map based on Kouli et al. Kouli, Soupios, and Vallianatos (2009):
- SAN = Sand in %
- SIL = Silt in %
- CLA = Clay in %
- C = Soil organic carbon in %
\[ Fcsand = 0.2 + 0.3exp(-0.0256 SAN(1 - \frac{SIL}{100})) \] \[\\[0.5cm]\] \[ Fsi-cl = \frac{SIL}{CLA+SIL}^{0.3} \] \[\\[0.5cm]\] \[ Forgc = 1- \frac{0.25C}{C + exp(3.72 -2.95C)} \] \[\\[0.5cm]\] \[ Fhisand = 1- \frac{0.7(\frac{SAND - 1}{100})}{(\frac{SAND - 1}{100}) + exp (-5.51+22.9 (\frac{SAN - 1}{100}))} \] \[\\[0.5cm]\] \[ K = Fcsand * Fsi-cl *Forgc *Fhisand *0.1317 \]
1.2.3 LS factor
The slope length and steepness factor was computed from the DEM under SAGA GIS 7.8.2. We used the LSFactor single way with the Desmet and Govers 1996 method.
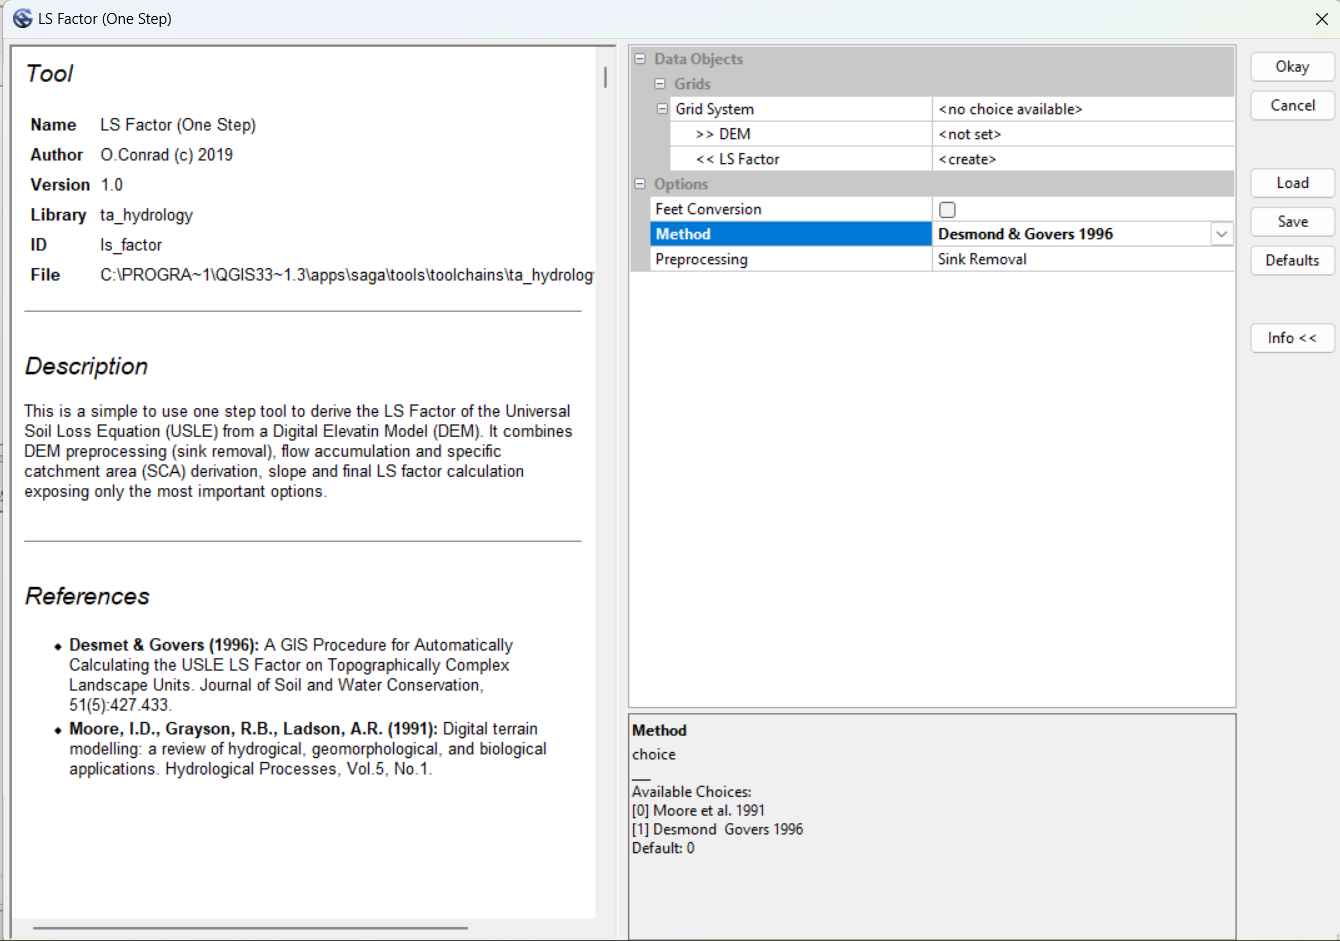
Figure 1.2: SAGA Ls factor with the One Step tool.
For more detail of the LS parameters:
- \(S_j\) = Slope factor for the j-th segment.
- \(\lambda_j\) = Distance from the lower boundary of the j-th segment to the upslope (m).
- \(m\) = length exponent of the RUSLE Ls factor.
\[ LSj = \frac{Sj(\lambda_j~^{m+1}-\lambda\frac{m + 1}{j - 1})}{(\lambda_j-\lambda_{j-1})22.13^m} \]
1.2.4 C factor
It was based on the land cover map of Copernicus data set and divided into 6 different classes. Then, based on a literature review, a ratio was established (Morgan 2005; Swarnkar et al. 2018).
| Land use | Value |
|---|---|
| Water | 0 |
| Forest | 0.001 |
| Shrubland | 0.01 |
| Urban Area | 0.1 |
| Cropland | 0.2 |
| Wasteland | 1 |
1.2.5 P factor
P is the conservation factor value. It is difficult to establish in the region as no previous work has been done. As no value was known for this factor, we put a 1 value default as in Mehri et al. (2024).
1.3 Results
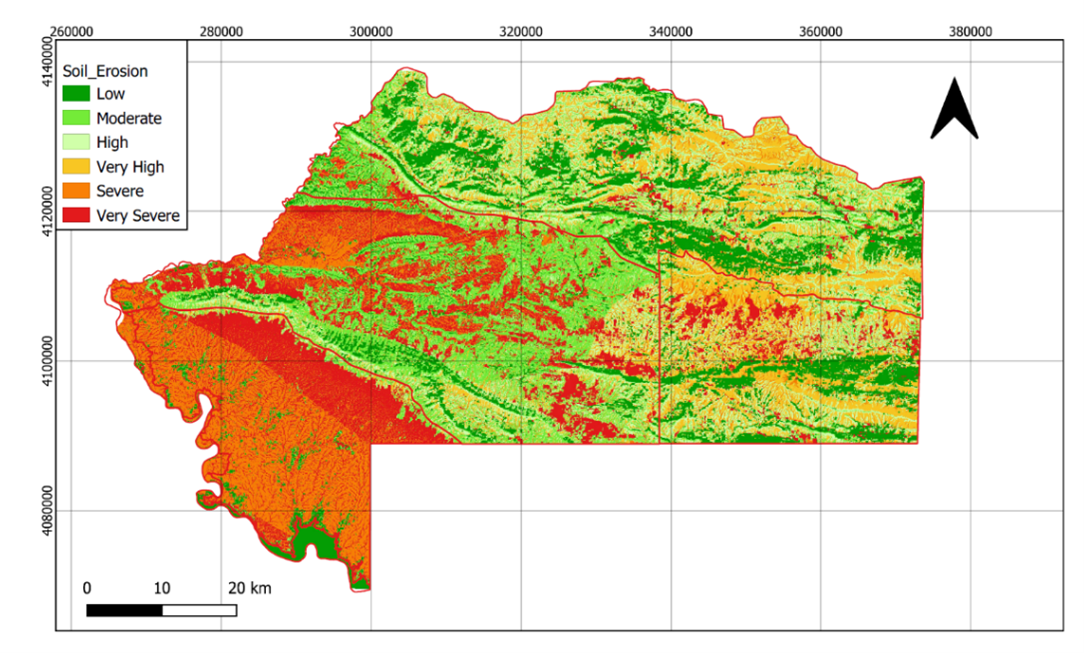
The erosion map shows a low erosion at Mg/ha-1 year-1 in terms of quantity. Most of the values are under 1.7, and only a few are above it. However, with a quantile classification (not based on continuous classification), we were able to spot the area with more erosion. It is mainly an area on the south of the Be’khair anticline in the Swaka Tika anticline and the upper region of Zakho (under the anticline). The northern and western areas are more preserved from soil erosion as the high anticline is probably due to less land use and forest presence. When the slope factor mainly influences the wadi and river border, the precipitation factor strongly influences the upper Khabur valley. The soil factor seems to have a minor influence on the middle and upper Khabur valley and on the right bank of the Tigris. The most preserved areas are the river and Mosul Lake.
| Statistic | Value (Mg/ha-1 year-1) |
|---|---|
| Min. value | 0 |
| Max. value | 117 |
| Mean value | 1.17561 |
| SD | 3.1574 |
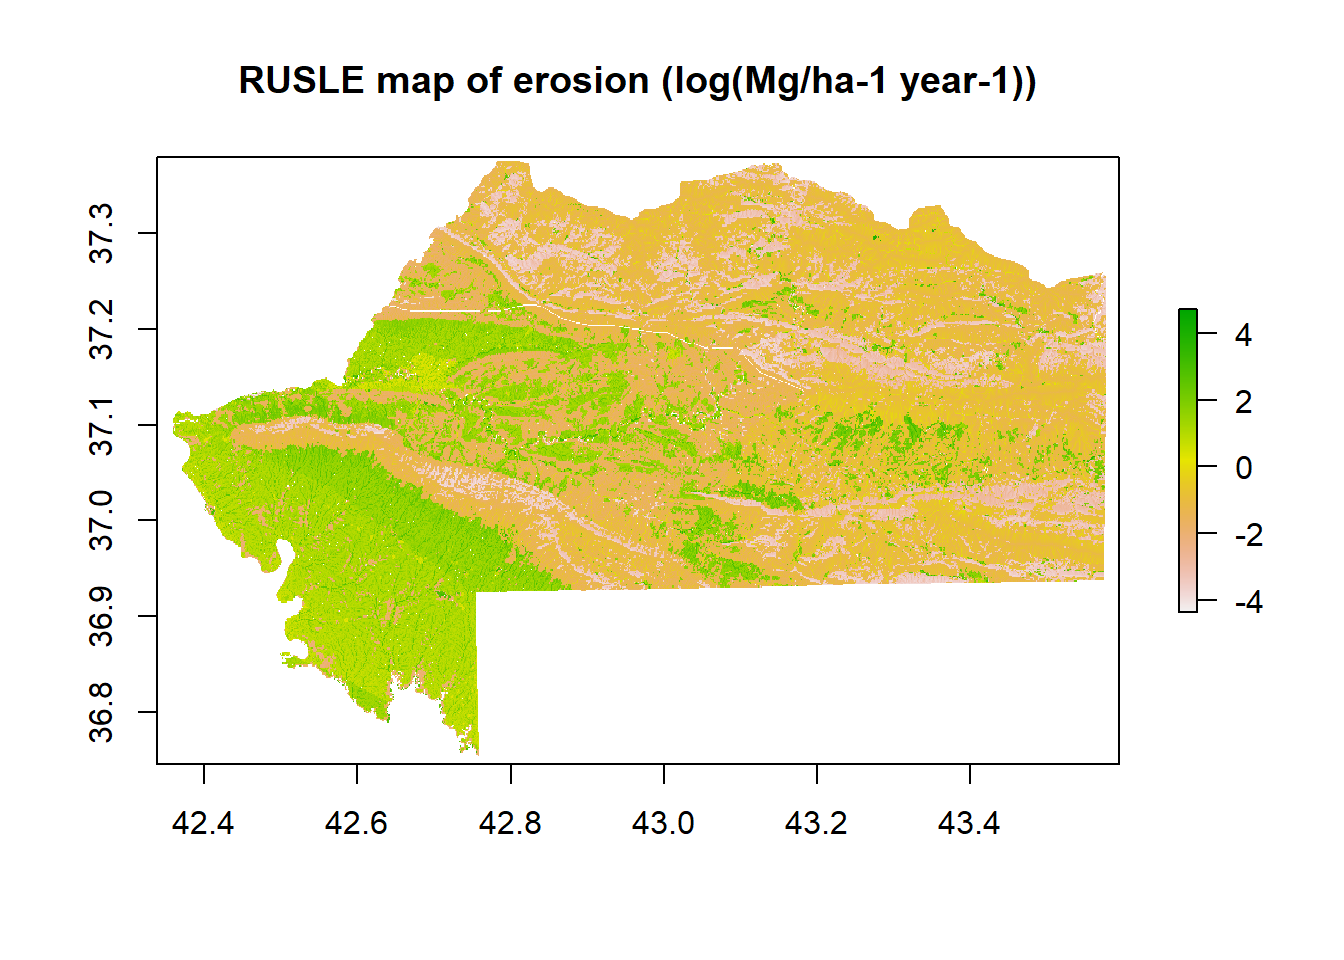
(#fig:erosion map)RUSLE map of erosion in Mg/ha-1 year-1 (WGS84, UTM38N).
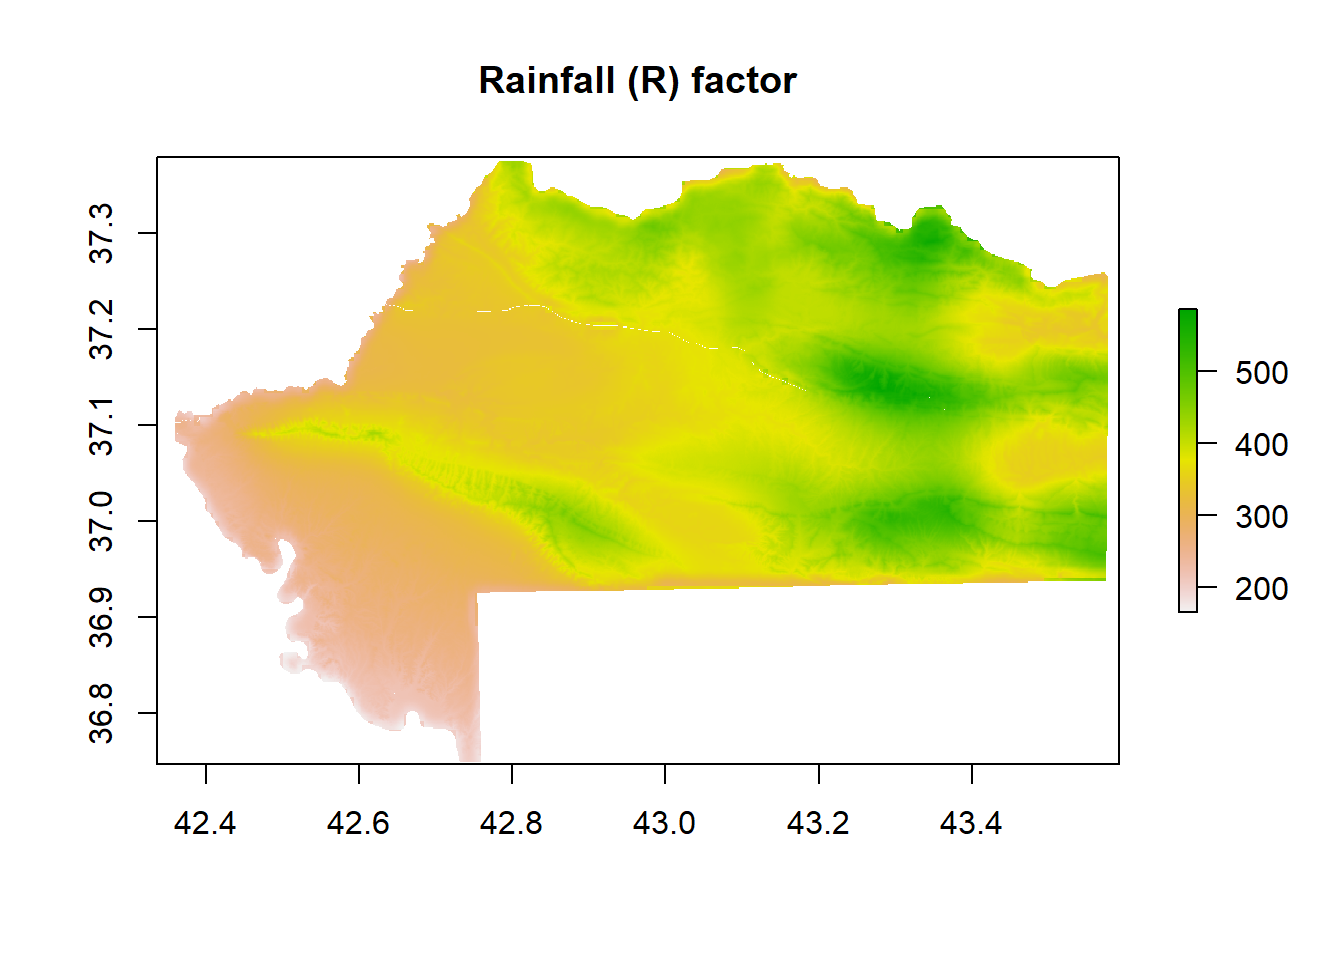
(#fig:R factor)Rainfall (R) factor (WGS84, UTM38N).
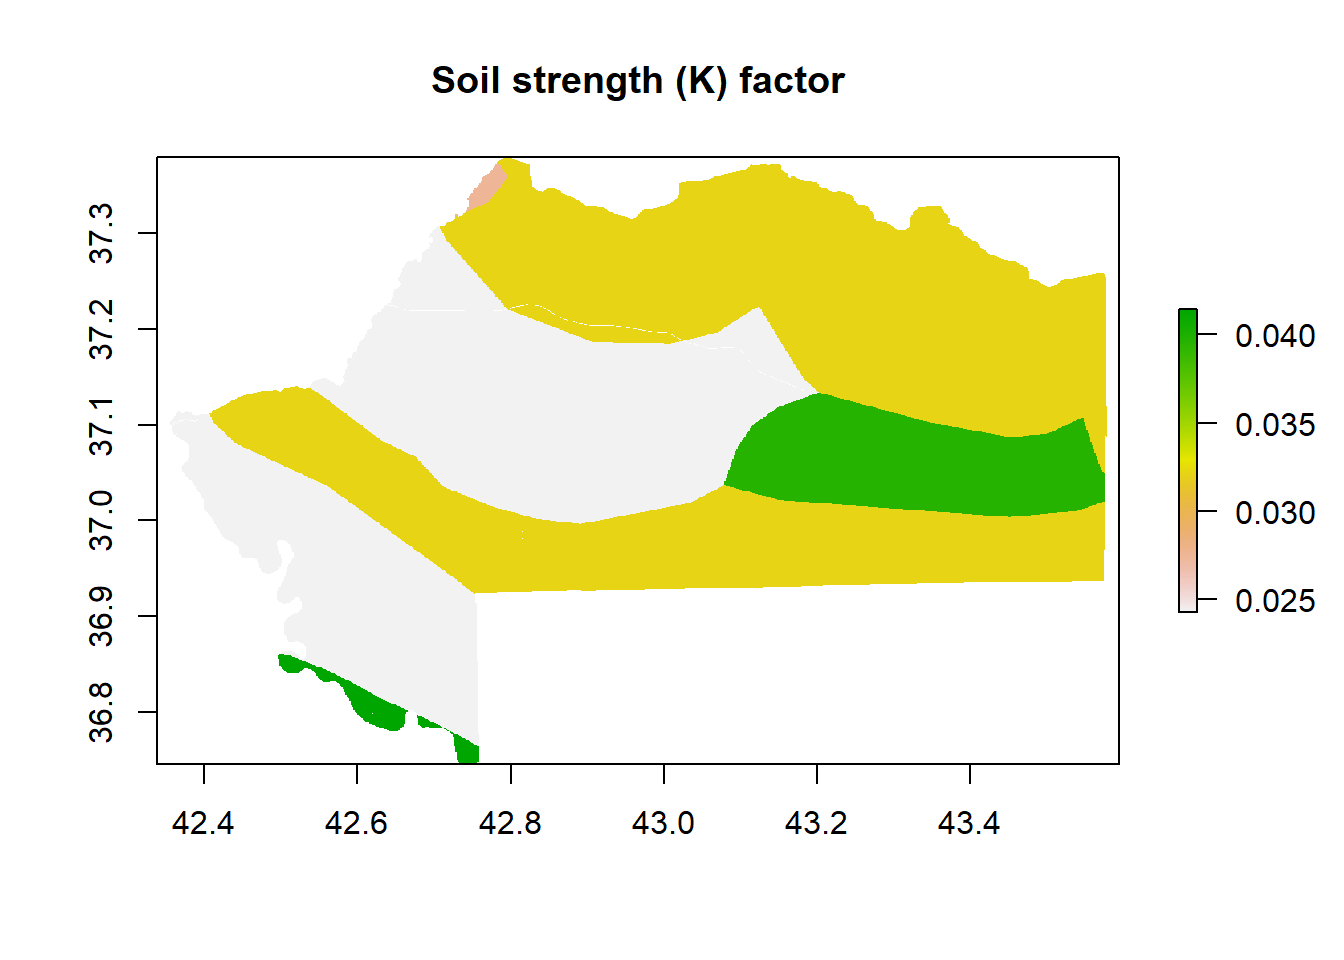
(#fig:K factor)Soil strength (K) factor (WGS84, UTM38N).
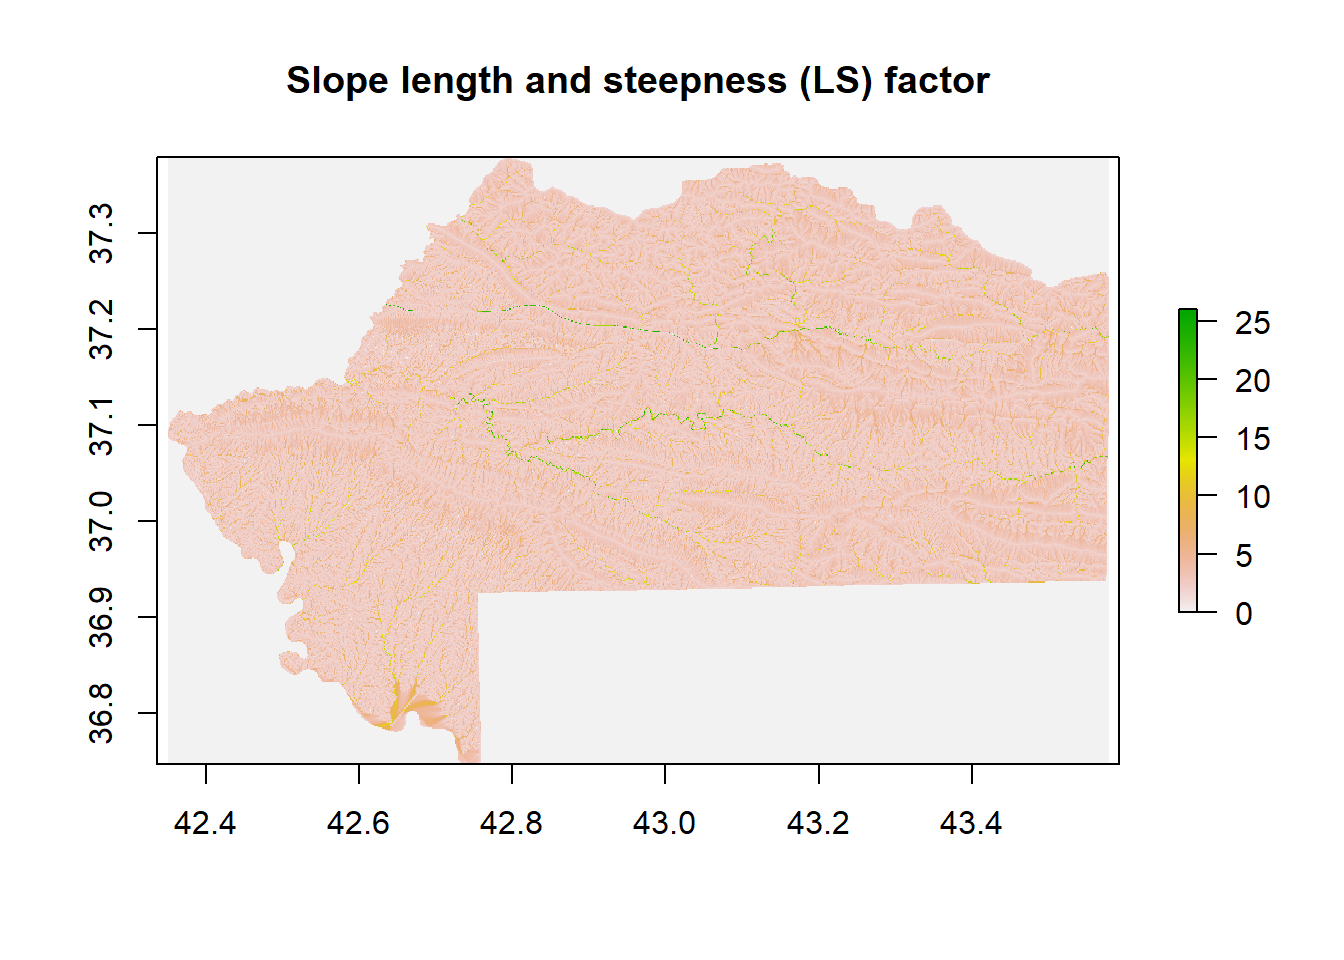
(#fig:LS factor)Slope length and steepness (LS) factor (WGS84, UTM38N).

(#fig:C factor)Land uses (C) factor (WGS84, UTM38N).