5 Laboratory measurement of the selected soil samples
5.1 Protocol
Following the selection of samples with the Kennard Stone sampling strategy we had a total of 108 samples (29 for 2017 - 2018, 50 for 2022 and 29 for 2023) to measure in the laboratory. First, the samples were air dried (35 - 45?C) for 24 h, root fragments were removed, and sieved (< 2 mm). Additionally, the samples measured with the elementary particles analyser, were ground under 1 µm with a Pulverisette 5/4, classic line (Fritsh, Idar-Oberstein, Germany) in a 250 ml hardness stainless steel container (ISO: X105CrMo17) with five 20 mm sintered corrodium (99.7% Al2O3) grinding balls.
5.2 Properties
All the results from the laboratory measurement are accessible at: Bellat, Mathias; Glissmann, Benjamin; Rentschler, Tobias; Sconzo, Paola; Pfälzner, Peter; Brifkany, Bekas; Scholten, Thomas (2024): “Soil properties in the North-Western Kurdistan region, Iraq, derived from laboratory measurements [dataset]”. PANGAEA, https://doi.org/10.1594/PANGAEA.973701
We measured a total of 8 properties containing chemical, physical and biological attributes:
- pH measured with Potassium chloride (KCl) solution with ProfiLine pH 3310 and a WTW SenTix 81 pH electrode (Fisher Scientific, Strabourg, France).
- CaCO\(_3\) carbonate calcium calculate in purcent with a calcimeter 08.53 (Royal Eijkelkamp, Giesbeek, Netherlands).
- Nt total nitrate calculated in percent with a Vario EL III (Elementar, Hanau, Germany).
- Ct total carbon calculated in percent with a Vario EL III (Elementar, Hanau, Germany).
- St total sulfur calculated in percent with a Vario EL III (Elementar, Hanau, Germany).
- Corg total organic calculated in percent with a Vario EL III (Elementar, Hanau, Germany).
- EC electro-conductivity measured in micro-siemens per centimeters with a Cond 330i/340i (WTW, Weilheim in Oberbayern, Germany).
- Texture measured in percent either with wet sieving for the sand or with a SediGraph III 5120 combined with an autosampler MasterTech MT 052 for lower fractions (Micromeritics, Norcross, USA).
5.3 Non mesured samples
Due to the low amount of sample material collected, some measurements were not possible to realise. All the 2017 - 2018 had not enough material ( < 5 gr.), after texture analysis, to measure their electro-conductivity and samples 41614 and 53881 had less than 10 gr. collected, which was not enough for texture measurement.
5.4 Texture mesurment
The texture was divided texture into diverse classes and we also measured the mean weight diameter (MWD) in mm with the following formula.
\[ MWD = Xi * Wi/100 \] Where:
- Xi the average diameter in mm.
- Wi the percentage of aggregate.
It can occurs that the total of the measured texture is not perfectly equal to 100%.
| Texture class | Diameter in mm |
|---|---|
| Coarse sand | 2 - 0.63 |
| Medium sand | 0.63 - 0.2 |
| Fine sand | 0.2 - 0.125 |
| Fine fine sand | 0.125 - 0.063 |
| Total sand | 2 - 0.063 |
| Coarse silt | 0.063 - 0.02 |
| Medium silt | 0.02 - 0.0063 |
| Fine silt | 0.0063 - 0.002 |
| Total silt | 0.063 - 0.002 |
| Coarse clay | 0.002 - 0.00063 |
| Medium and fine clay | 0.00063 - 0.000063 |
| Total clay | 0.002 - 0.000063 |
| Total silt and clay | 0.063 - 0.000063 |
| Total sand, silt and clay | 2 - 0.000063 |
5.6 Properties of the measured samples
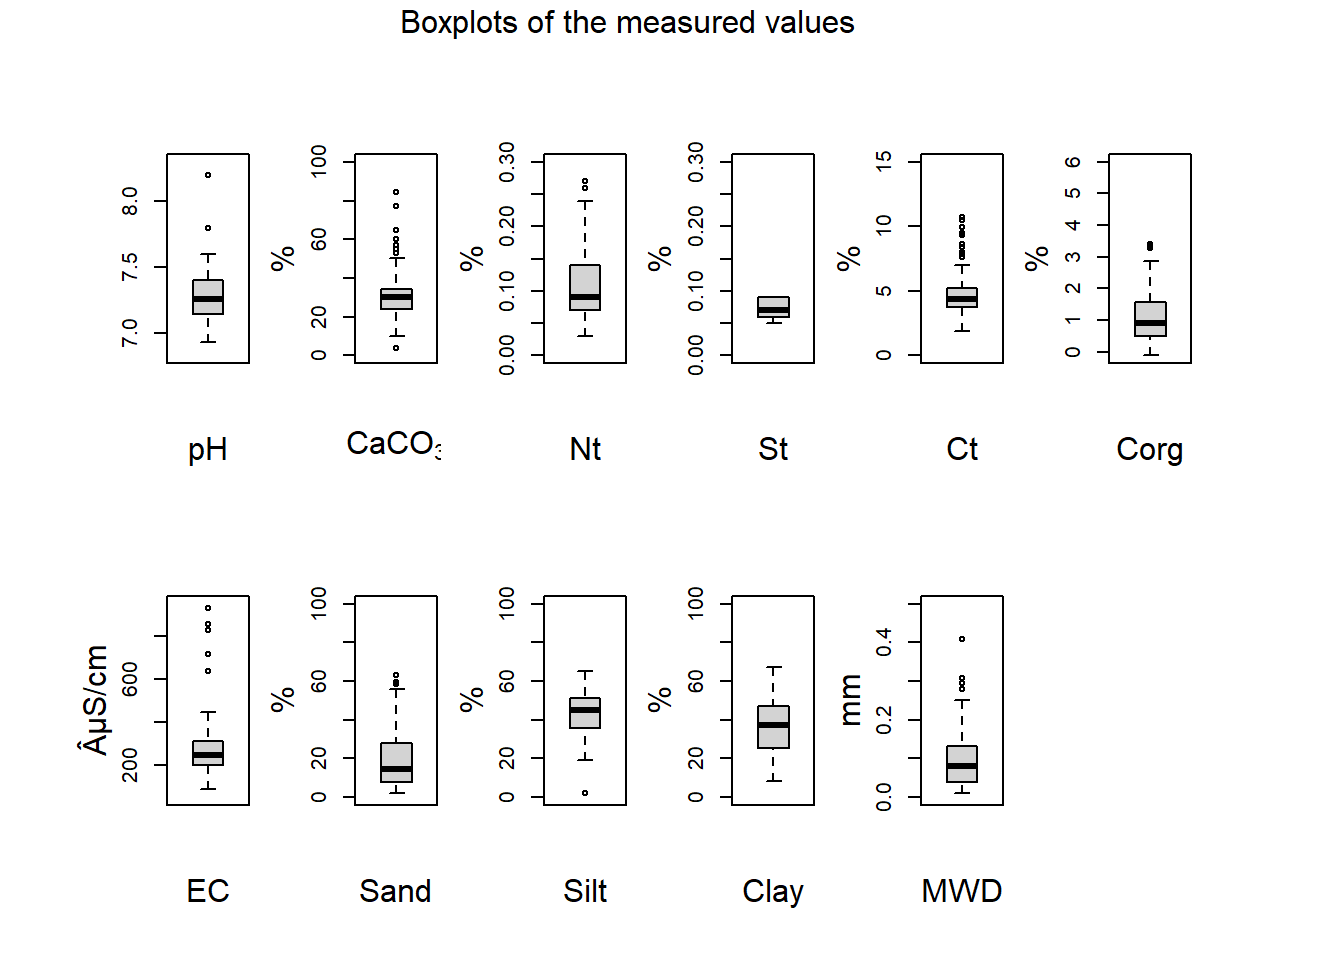
Vario EL III analyser is not able to measure Nt content lower than 0.03% and St content lower than 0.05%. Therefore, the Sulfur was not predicted as its values were to low.
# Remove the non measured samples
Lab$Nt[Lab$Nt== "< 0.03"] <- NA
Lab$Nt <- as.numeric(Lab$Nt)

Lab$St[Lab$St == "< 0.05"] <- NA
Lab$St <- as.numeric(Lab$St)

# Component values ======================================
par(mfrow = c(2, 6), mar = c(5.1, 4.1, 4.1, .1), oma = c(1, 2.5, 2, 5.9),
    mgp = c(3, 1, 0), las = 0, cex.lab = 1, cex.axis = 1, cex.lab = 1.5, xpd = FALSE)

# c(min(Soil_Data_Observed$pH)-0.1, max(Soil_Data_Observed$pH)+0.1))
boxplot(Lab$pH, xlab = "pH", ylab = "", ylim =  c(min(Lab$pH)-0.1, max(Lab$pH)+0.1))
boxplot(Lab$CaCO3, xlab = expression("CaCO"[3]), ylab = "", ylim = c(0,100)); title(ylab = "%", line = 2.25)
boxplot(Lab$Nt, xlab = "Nt", ylab = "", ylim = c(0, 0.3)); title(ylab = "%", line = 2.25)
boxplot(Lab$St, xlab = "St", ylab = "", ylim = c(0,0.3)); title(ylab = "%", line = 2.25)
boxplot(Lab$Ct, xlab = "Ct", ylab = "", ylim = c(0,15)); title(ylab = "%", line = 2.25)
boxplot(Lab$Corg, xlab = "Corg", ylab = "", ylim = c(min(Lab$Corg)-0.01, 6)); title(ylab = "%", line = 2.25)
boxplot(Lab$EC, xlab = "EC", ylab = "", ylim = c(50, 950)); title(ylab = "µS/cm", line = 2.25)
boxplot(Lab$Σsand, xlab = "Sand", ylab = "", ylim = c(0, 100)); title(ylab = "%", line = 2.25)
boxplot(Lab$`Σsilt `, xlab = "Silt", ylab = "", ylim = c(0, 100)); title(ylab = "%", line = 2.25)
boxplot(Lab$Σclay, xlab = "Clay", ylab = "", ylim = c(0, 100)); title(ylab = "%", line = 2.25)
boxplot(Lab$MWD, xlab = "MWD", ylab = "", ylim = c(0, 0.5)); title(ylab = "mm", line = 2.25)
mtext("Boxplots of the measured values", outer = TRUE, line = 0.5, cex = 1)
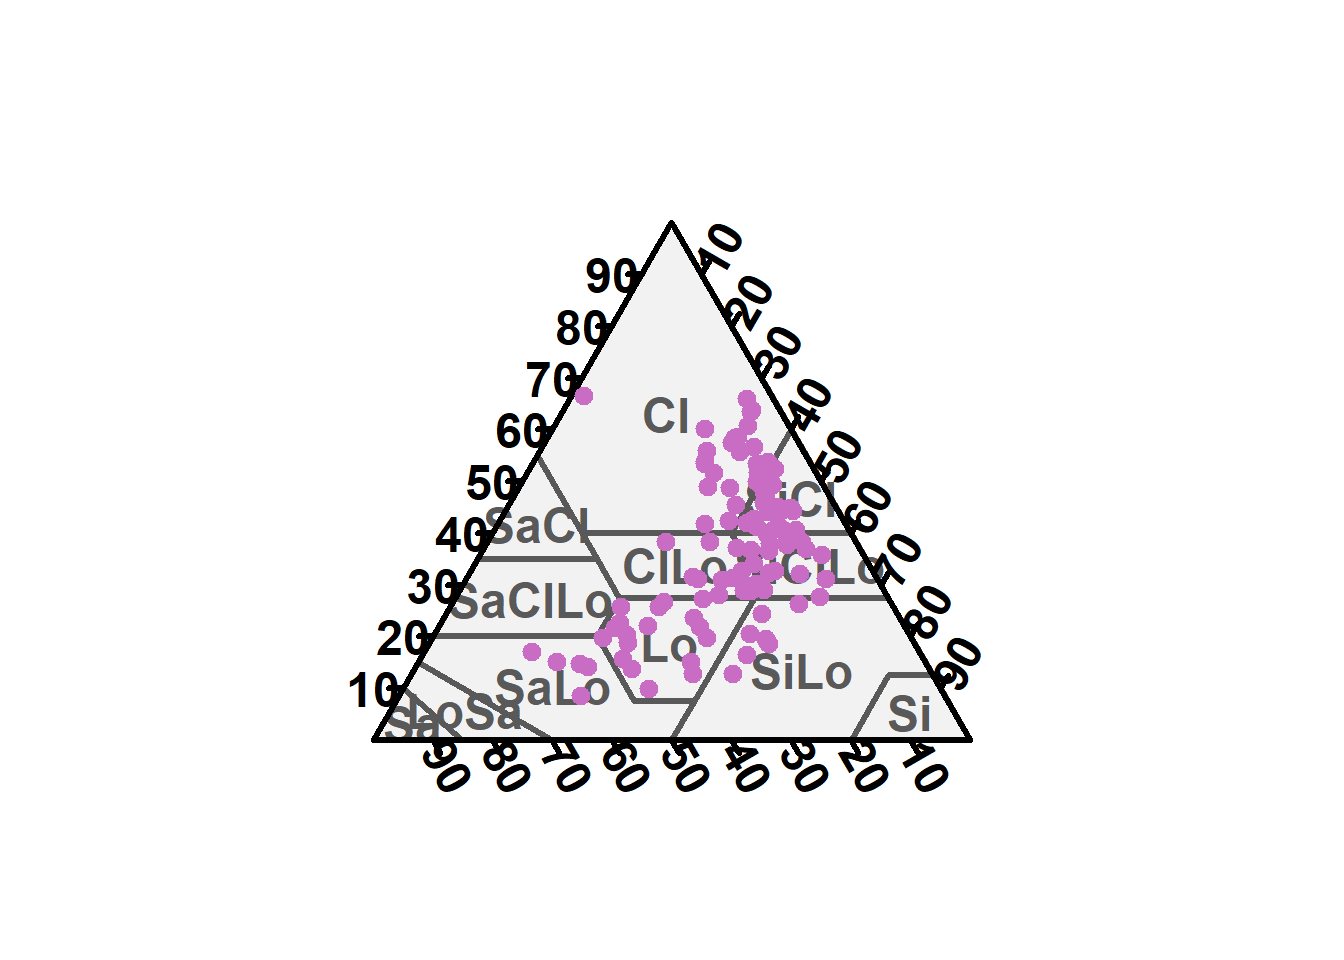
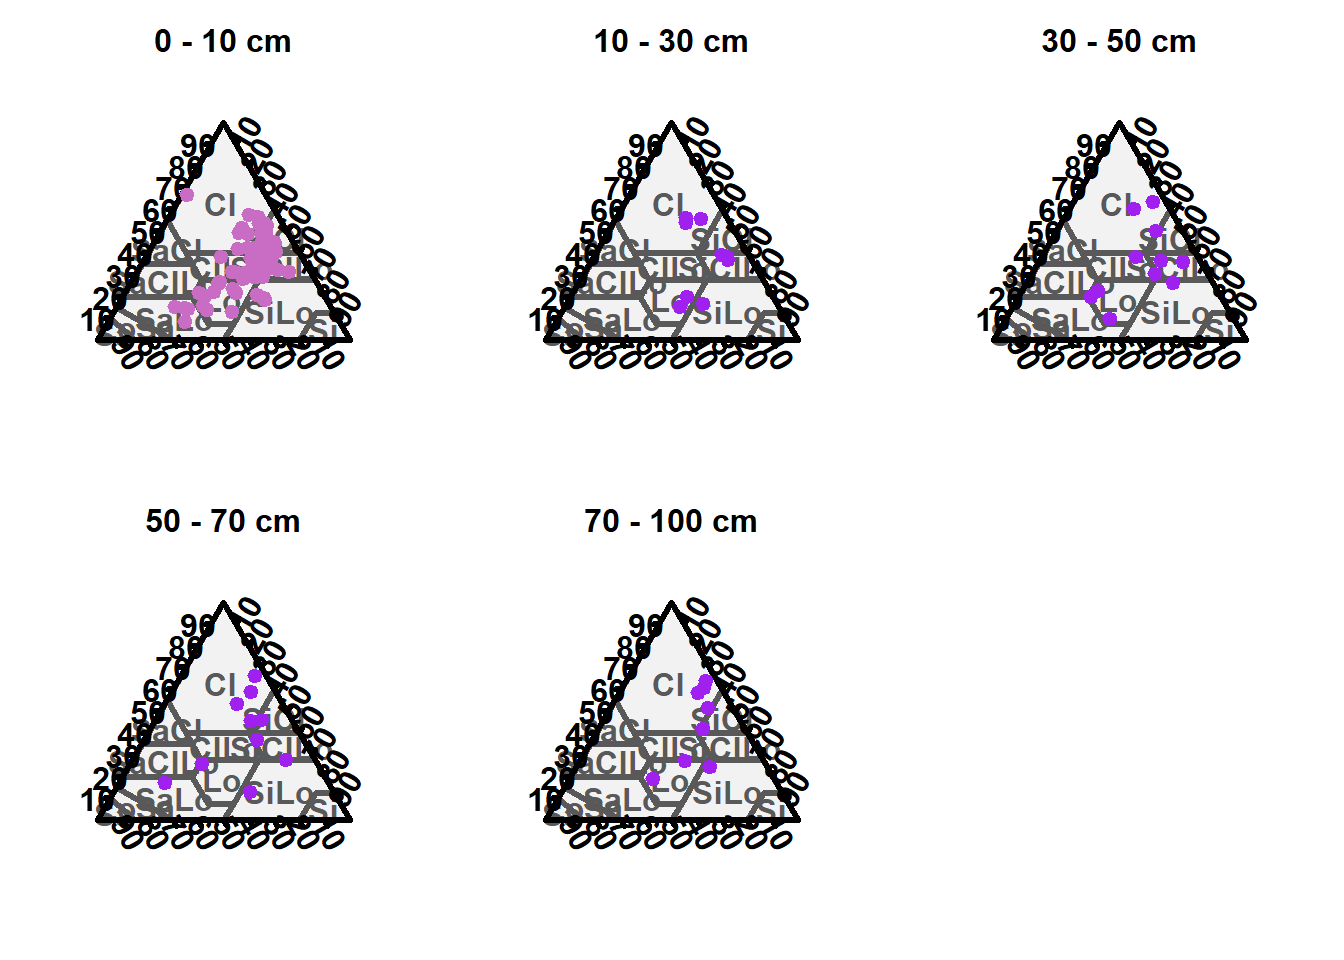
We ploted the soil texture according to (WRB 2006) classification for each soil depth increment.
library(soiltexture)
#Soil texture
texture <- data.frame("SAND" = Lab$Σsand, "SILT" = Lab$`Σsilt `, "CLAY" = Lab$Σclay)
row.names(texture) <- Lab$`Lab label`
texture <- na.omit(texture)
texture <- TT.normalise.sum(texture, css.names =  c("SAND","SILT", "CLAY"))

texture <- TT.text.transf(
  tri.data = texture, dat.css.ps.lim = c(0, 0.002, 0.063, 2),  # German system
  base.css.ps.lim = c(0, 0.002, 0.05, 2) # USDA system
)

TT.plot(class.sys = "USDA.TT", tri.data = texture, main = "", frame.bg.col = "#f2f2f2", grid.show = FALSE, arrows.show = FALSE, col = "#c96dc4", pch = 19, cex = 1, css.lab = c("Clay", "Silt", "Clay"))
#Soil texture
texture <- data.frame("SAND" = Lab$Σsand, "SILT" = Lab$`Σsilt `, "CLAY" = Lab$Σclay, "depth" = Lab$`Depth, bot`)
row.names(texture) <- Lab$`Lab label`
texture <- na.omit(texture)

texture_resize <- texture[,c(1:3)]
texture_resize <- TT.normalise.sum(texture_resize, css.names =  c("SAND","SILT", "CLAY"))

texture_resize <- TT.text.transf(
  tri.data = texture_resize, dat.css.ps.lim = c(0, 0.002, 0.063, 2),  # German system
  base.css.ps.lim = c(0, 0.002, 0.05, 2) # USDA system
)
texture <- cbind(texture_resize, texture[,4])

text.zero <- texture[texture[,4] == 0.1,]
text.ten <- texture[texture[,4] == 0.3,]
text.thirty <- texture[texture[,4] == 0.5,]
text.fifty <- texture[texture[,4] == 0.7,]
text.seventy <- texture[texture[,4] == 1,]
par(mfrow = c(2, 3))
TT.plot(class.sys = "USDA.TT", tri.data = text.zero, main = "0 - 10 cm", frame.bg.col = "#f2f2f2", grid.show = FALSE, arrows.show = FALSE, col = "#c96dc4", pch = 19, cex = 1, css.lab = c("Clay", "Silt", "Clay"))
TT.plot(class.sys = "USDA.TT", tri.data = text.ten, main = "10 - 30 cm", frame.bg.col = "#f2f2f2", grid.show = FALSE, arrows.show = FALSE, col = "purple", pch = 19, cex = 1, css.lab = c("Clay", "Silt", "Clay"))
TT.plot(class.sys = "USDA.TT", tri.data = text.thirty, main = "30 - 50 cm", frame.bg.col = "#f2f2f2", grid.show = FALSE, arrows.show = FALSE, col = "purple", pch = 19, cex = 1, css.lab = c("Clay", "Silt", "Clay"))
TT.plot(class.sys = "USDA.TT", tri.data = text.fifty, main = "50 - 70 cm", frame.bg.col = "#f2f2f2", grid.show = FALSE, arrows.show = FALSE, col = "purple", pch = 19, cex = 1, css.lab = c("Clay", "Silt", "Clay"))
TT.plot(class.sys = "USDA.TT", tri.data = text.seventy, main = "70 - 100 cm", frame.bg.col = "#f2f2f2", grid.show = FALSE, arrows.show = FALSE, col = "purple", pch = 19, cex = 1, css.lab = c("Clay", "Silt", "Clay"))